231 lines
10 KiB
Plaintext
231 lines
10 KiB
Plaintext
Metadata-Version: 2.1
|
||
Name: ansible-playbook-grapher
|
||
Version: 1.2.0
|
||
Summary: A command line tool to create a graph representing your Ansible playbook tasks and roles
|
||
Home-page: https://github.com/haidaraM/ansible-playbook-grapher
|
||
Author: HAIDARA Mohamed El Mouctar
|
||
Author-email: elmhaidara@gmail.com
|
||
License: MIT
|
||
Download-URL: https://github.com/haidaraM/ansible-playbook-grapher/archive/v1.2.0.tar.gz
|
||
Platform: UNKNOWN
|
||
Classifier: Development Status :: 5 - Production/Stable
|
||
Classifier: Intended Audience :: Developers
|
||
Classifier: Intended Audience :: System Administrators
|
||
Classifier: License :: OSI Approved :: GNU General Public License v3 (GPLv3)
|
||
Classifier: Environment :: Console
|
||
Classifier: Topic :: Utilities
|
||
Classifier: Programming Language :: Python :: 3.8
|
||
Classifier: Programming Language :: Python :: 3.9
|
||
Description-Content-Type: text/markdown
|
||
License-File: LICENSE
|
||
Requires-Dist: ansible-core (<2.13,>=2.11)
|
||
Requires-Dist: graphviz (<1,>=0.18)
|
||
Requires-Dist: colour (<1)
|
||
Requires-Dist: lxml (<5)
|
||
Requires-Dist: svg.path (<7)
|
||
|
||
# Ansible Playbook Grapher
|
||
|
||

|
||
[](https://badge.fury.io/py/ansible-playbook-grapher)
|
||
[](https://coveralls.io/github/haidaraM/ansible-playbook-grapher?branch=main)
|
||
|
||
[ansible-playbook-grapher](https://github.com/haidaraM/ansible-playbook-grapher) is a command line tool to create a
|
||
graph representing your Ansible playbook plays, tasks and roles. The aim of this project is to have an overview of your
|
||
playbook.
|
||
|
||
Inspired by [Ansible Inventory Grapher](https://github.com/willthames/ansible-inventory-grapher).
|
||
|
||
## Features
|
||
|
||
The following features are available when opening the SVGs in a browser (recommended) or a viewer that supports
|
||
JavaScript:
|
||
|
||
- Highlighting of all the related nodes of a given node when clicking or hovering. Example: Click on a role to select
|
||
all its tasks when `--include-role-tasks` is set.
|
||
- A double click on a node opens its corresponding file or folders depending on if it's the playbook, a play, a task or
|
||
a role. By default, the browser will open folders and download files since it may not be able to render the YAML
|
||
file.
|
||
Optionally, you can
|
||
set [the open protocol to use VSCode](https://code.visualstudio.com/docs/editor/command-line#_opening-vs-code-with-urls)
|
||
with `--open-protocol-handler vscode`: it will open the folders when double-clicking on roles (not `include_role`) and
|
||
the files for the others nodes. The cursor will be at the task exact position in the file.
|
||
Lastly, you can provide your own protocol formats
|
||
with `--open-protocol-handler custom --open-protocol-custom-formats '{}'`. See the help
|
||
and [an example.](https://github.com/haidaraM/ansible-playbook-grapher/blob/main/ansibleplaybookgrapher/renderer.py#L27)
|
||
- Filer tasks based on tags
|
||
- Export the dot file using to generate the graph with Graphviz.
|
||
|
||
## Prerequisites
|
||
|
||
- Python 3.8 at least
|
||
- A virtual environment from which to run the grapher. This is **highly recommended** because the grapher depends on
|
||
some versions of ansible-core which are not necessarily installed in your environment and may cause issues if you use
|
||
some older versions of Ansible (
|
||
since `ansible` [package has been split](https://www.ansible.com/blog/ansible-3.0.0-qa)).
|
||
- **Graphviz**: The tool used to generate the graph in SVG.
|
||
```shell script
|
||
$ sudo apt-get install graphviz # or yum install or brew install
|
||
```
|
||
|
||
I try to respect [Red Hat Ansible Engine Life Cycle](https://access.redhat.com/support/policy/updates/ansible-engine)
|
||
for the supported Ansible version.
|
||
|
||
## Installation
|
||
|
||
```shell script
|
||
pip install ansible-playbook-grapher
|
||
```
|
||
|
||
## Usage
|
||
|
||
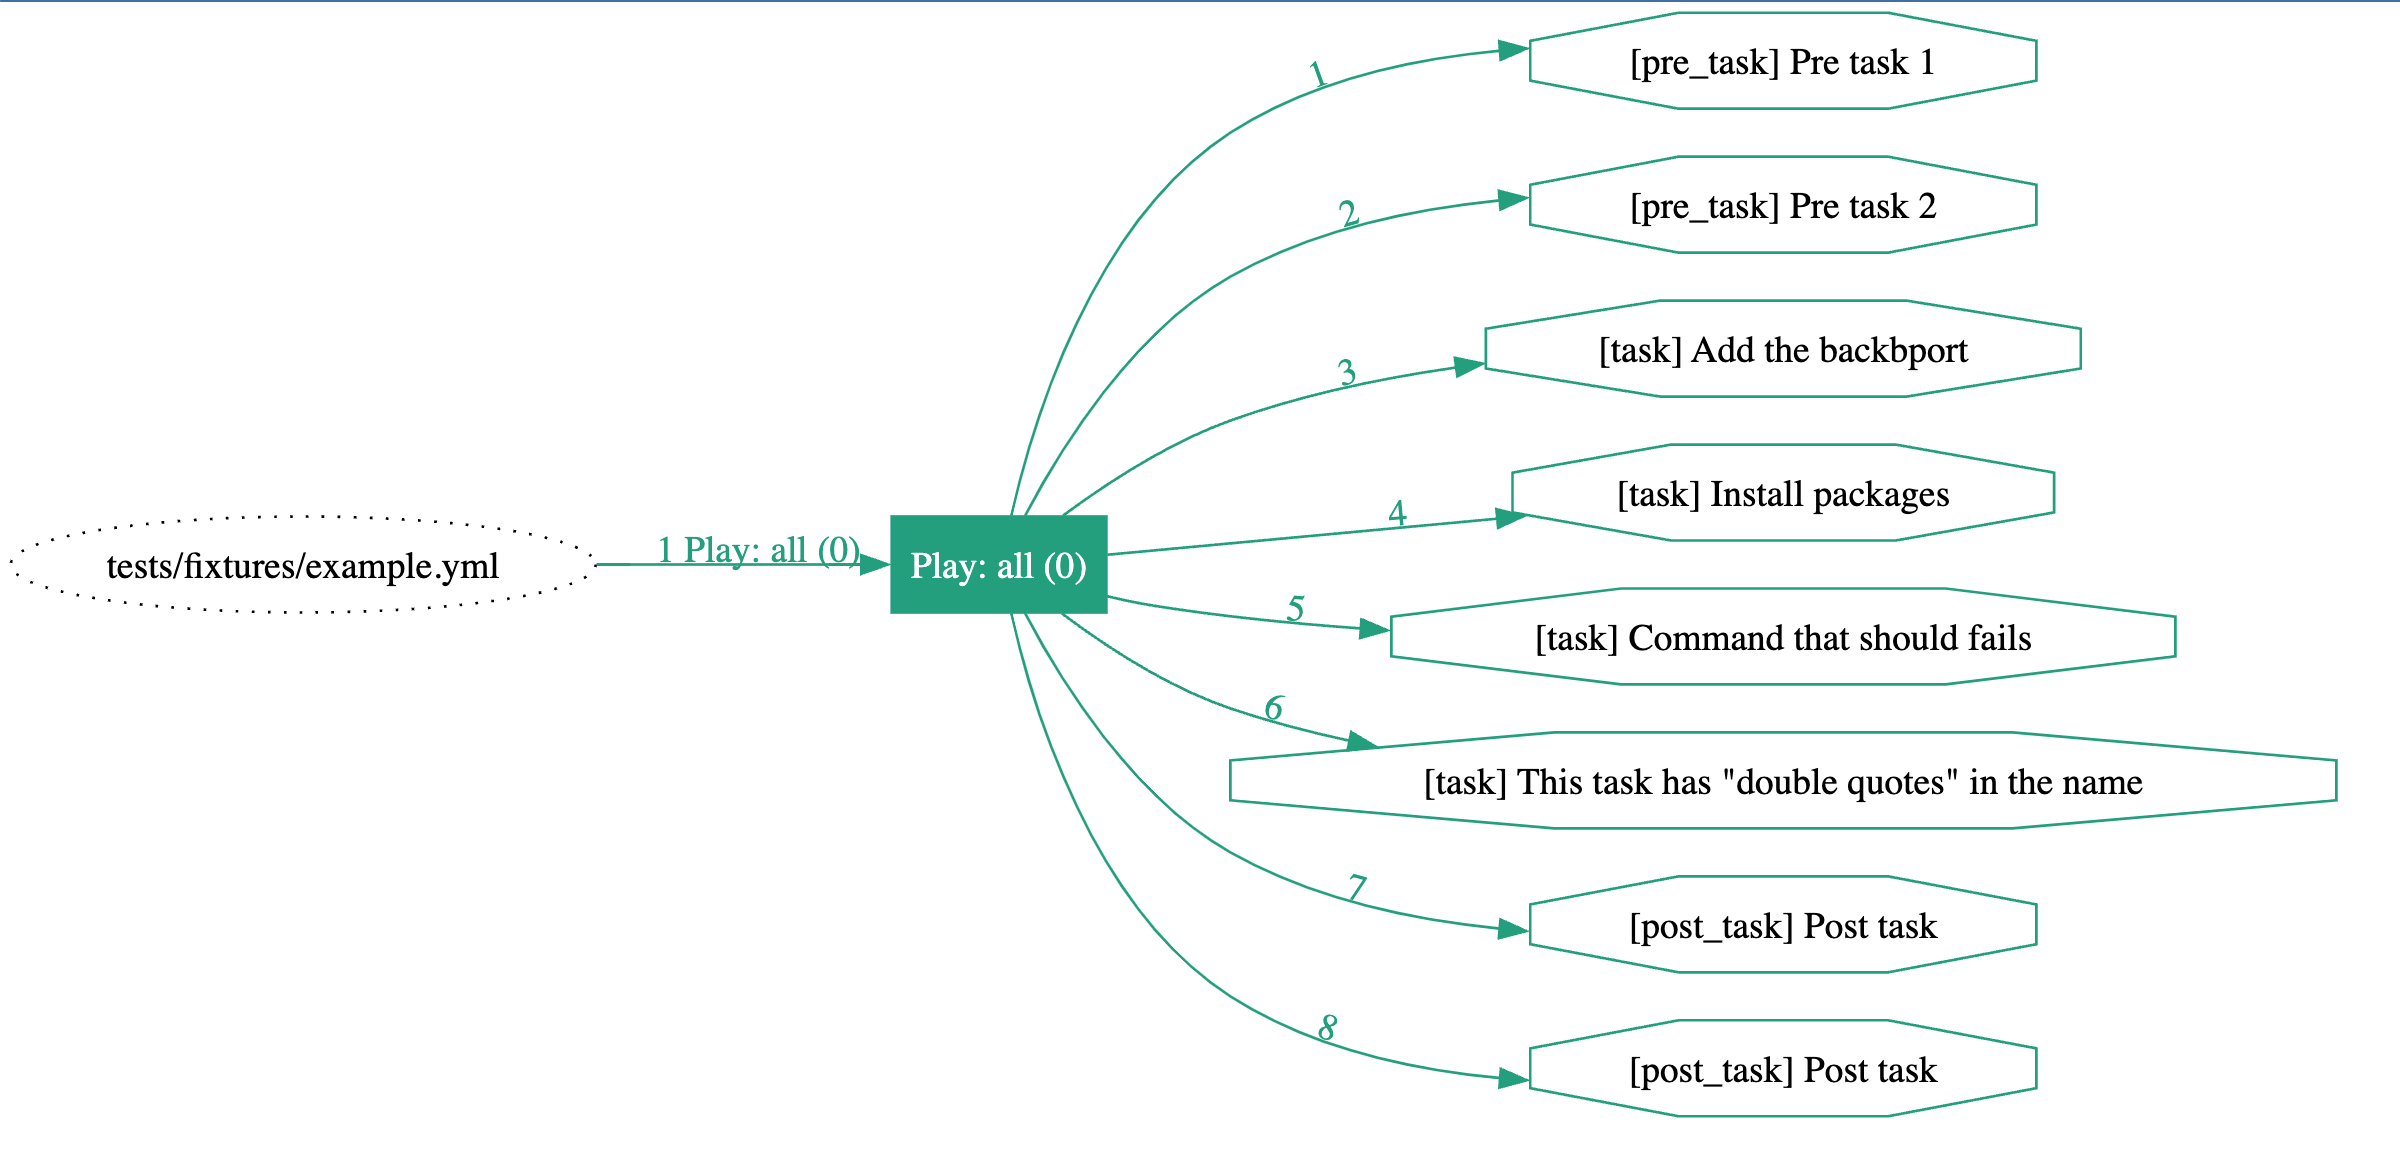
```shell
|
||
ansible-playbook-grapher tests/fixtures/example.yml
|
||
```
|
||
|
||
|
||
|
||
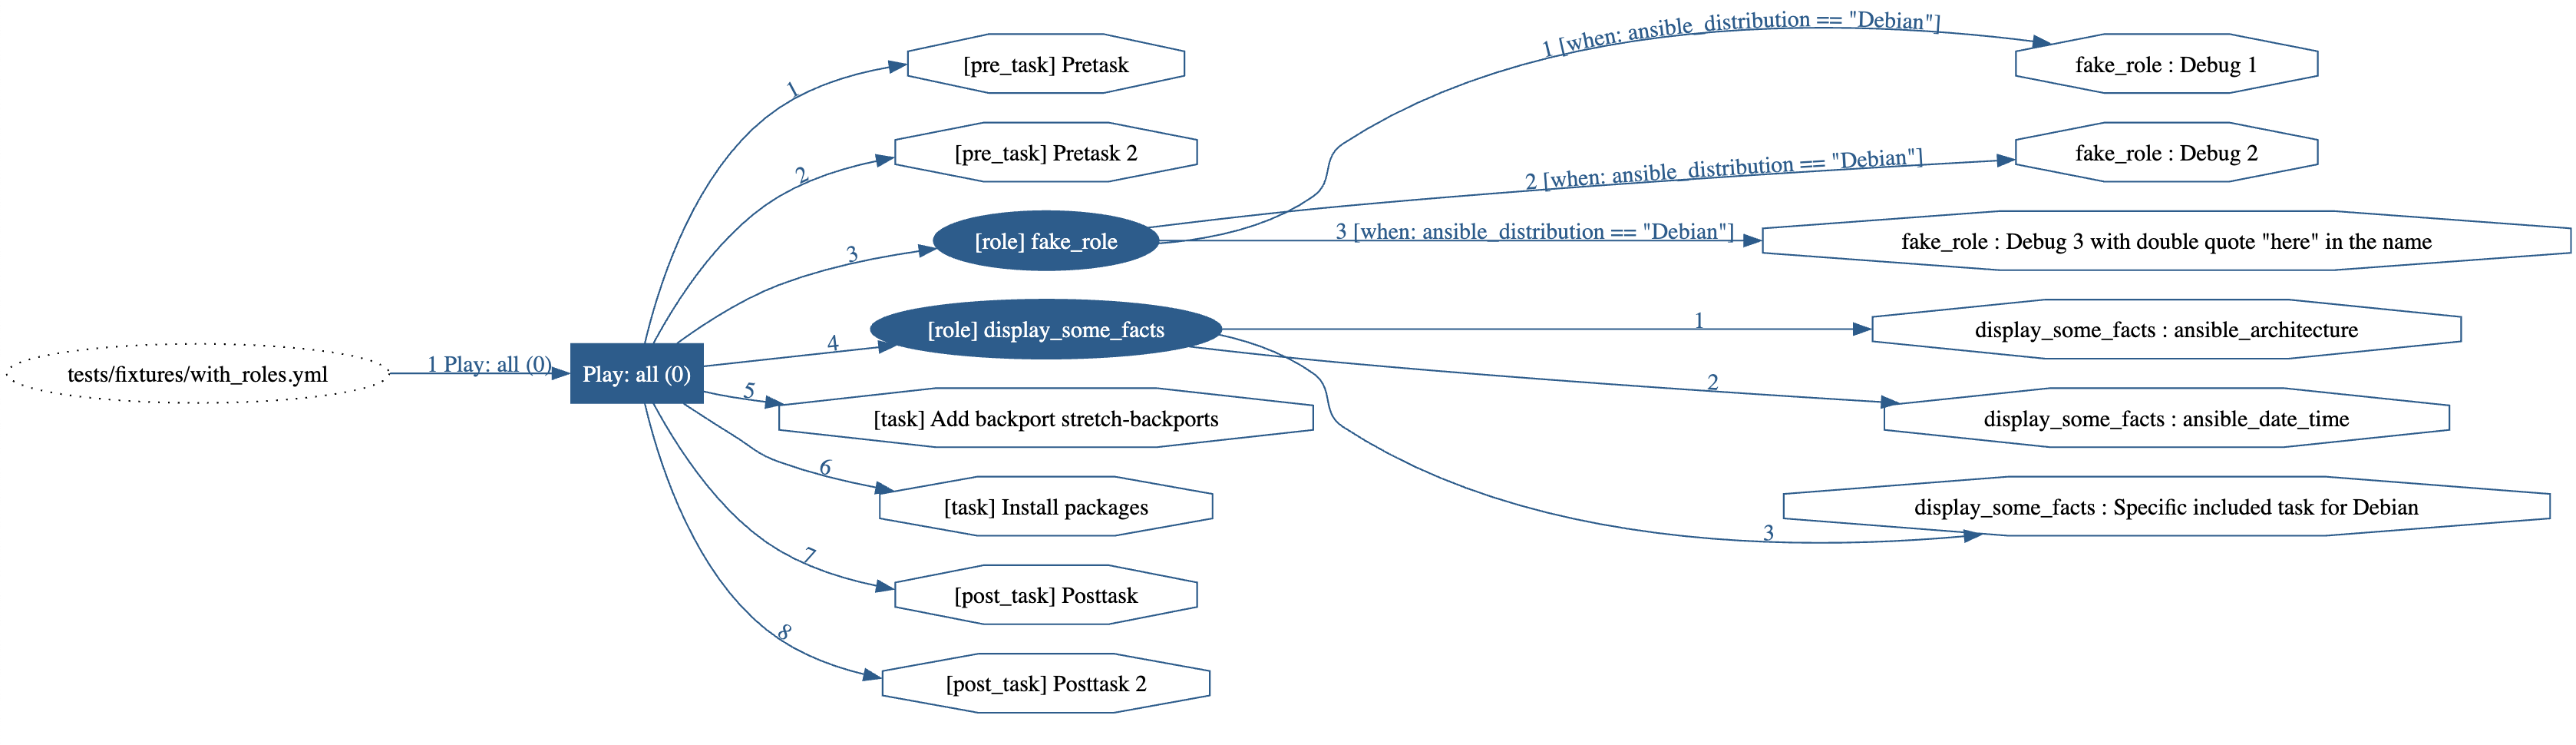
```bash
|
||
ansible-playbook-grapher --include-role-tasks tests/fixtures/with_roles.yml
|
||
```
|
||
|
||
|
||
|
||
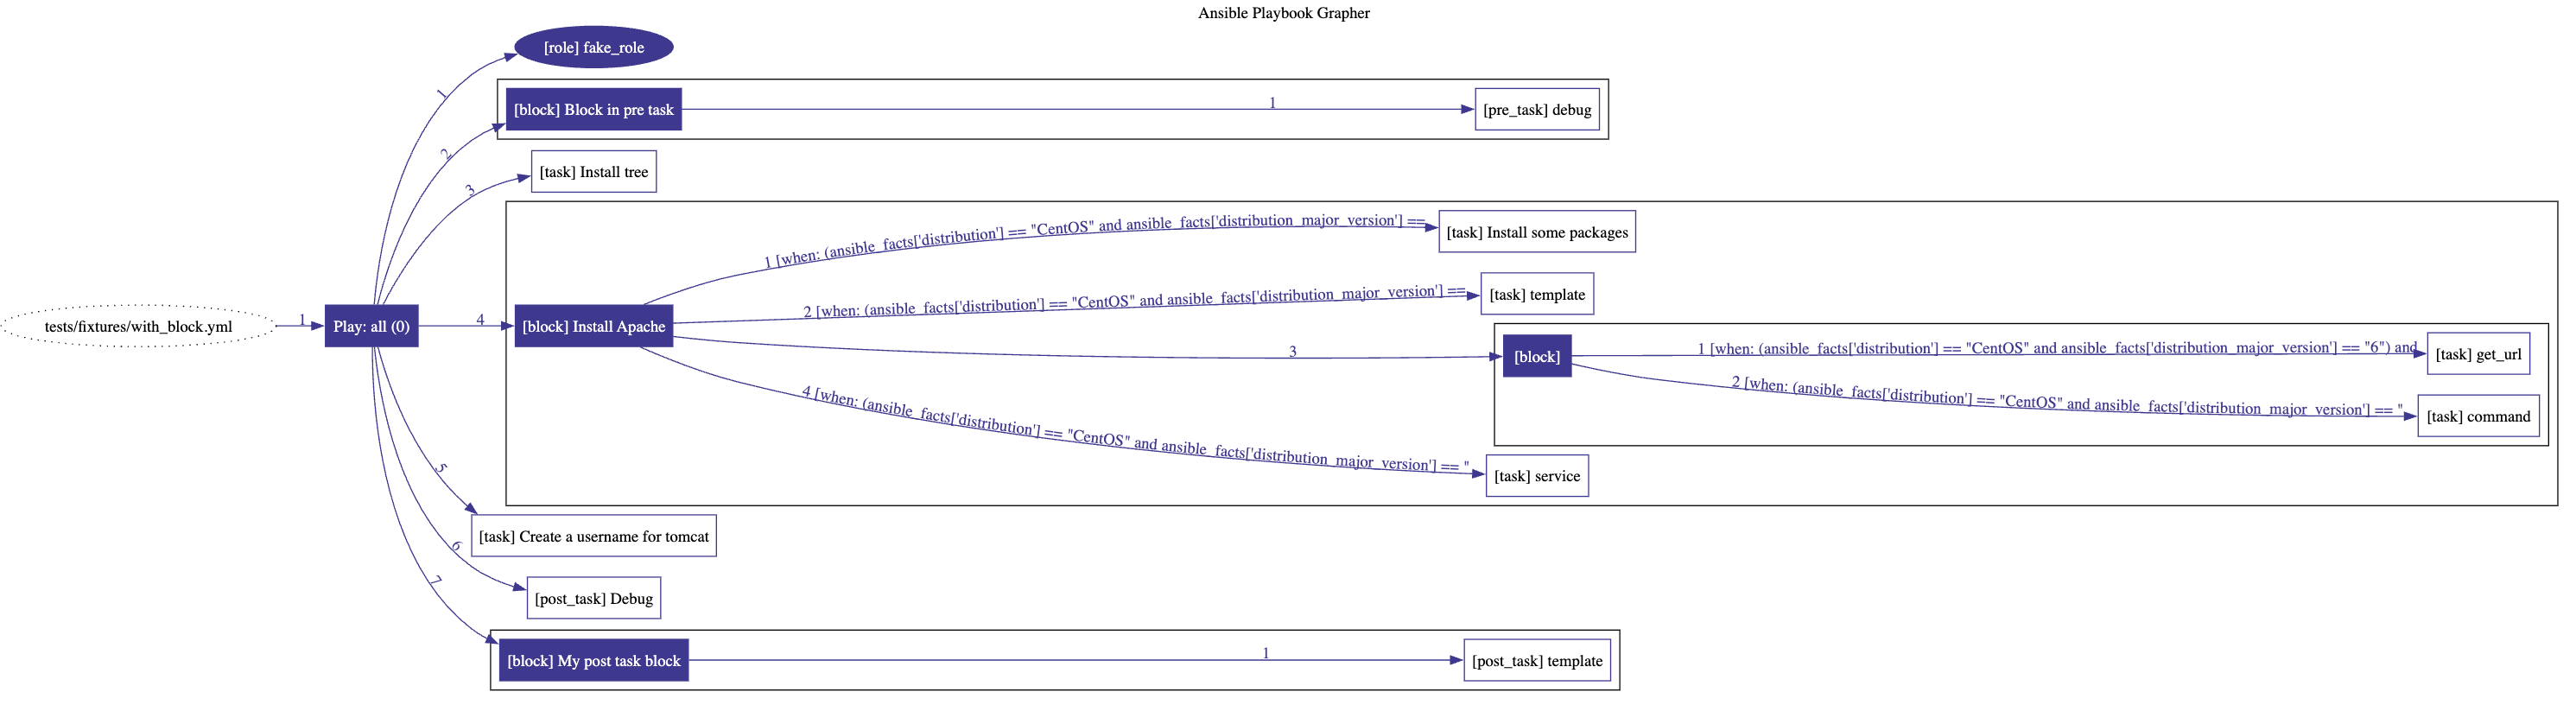
```bash
|
||
ansible-playbook-grapher tests/fixtures/with_block.yml
|
||
```
|
||
|
||
|
||
|
||
Note on block: Since `block`s are logical group of tasks, the conditional `when` is not displayed on the edges pointing
|
||
to them but on the tasks inside the block. This
|
||
mimics [Ansible behavior](https://docs.ansible.com/ansible/latest/user_guide/playbooks_blocks.html#grouping-tasks-with-blocks)
|
||
regarding the blocks.
|
||
|
||
### CLI options
|
||
|
||
The available options:
|
||
|
||
```
|
||
usage: ansible-playbook-grapher [-h] [-v] [-i INVENTORY]
|
||
[--include-role-tasks] [-s] [--view]
|
||
[-o OUTPUT_FILENAME]
|
||
[--open-protocol-handler {default,vscode,custom}]
|
||
[--open-protocol-custom-formats OPEN_PROTOCOL_CUSTOM_FORMATS]
|
||
[--group-roles-by-name] [--version] [-t TAGS]
|
||
[--skip-tags SKIP_TAGS] [--vault-id VAULT_IDS]
|
||
[--ask-vault-password | --vault-password-file VAULT_PASSWORD_FILES]
|
||
[-e EXTRA_VARS]
|
||
playbooks [playbooks ...]
|
||
|
||
Make graphs from your Ansible Playbooks.
|
||
|
||
positional arguments:
|
||
playbooks Playbook(s) to graph
|
||
|
||
optional arguments:
|
||
--ask-vault-password, --ask-vault-pass
|
||
ask for vault password
|
||
--group-roles-by-name
|
||
When rendering the graph, only a single role will be
|
||
display for all roles having the same names.
|
||
--include-role-tasks Include the tasks of the role in the graph.
|
||
--open-protocol-custom-formats OPEN_PROTOCOL_CUSTOM_FORMATS
|
||
The custom formats to use as URLs for the nodes in the
|
||
graph. Required if --open-protocol-handler is set to
|
||
custom. You should provide a JSON formatted string
|
||
like: {"file": "", "folder": ""}. Example: If you want
|
||
to open folders (roles) inside the browser and files
|
||
(tasks) in vscode, set this to '{"file":
|
||
"vscode://file/{path}:{line}:{column}", "folder":
|
||
"{path}"}'
|
||
--open-protocol-handler {default,vscode,custom}
|
||
The protocol to use to open the nodes when double-
|
||
clicking on them in your SVG viewer. Your SVG viewer
|
||
must support double-click and Javascript. The
|
||
supported values are 'default', 'vscode' and 'custom'.
|
||
For 'default', the URL will be the path to the file or
|
||
folders. When using a browser, it will open or
|
||
download them. For 'vscode', the folders and files
|
||
will be open with VSCode. For 'custom', you need to
|
||
set a custom format with --open-protocol-custom-
|
||
formats.
|
||
--skip-tags SKIP_TAGS
|
||
only run plays and tasks whose tags do not match these
|
||
values
|
||
--vault-id VAULT_IDS the vault identity to use
|
||
--vault-password-file VAULT_PASSWORD_FILES, --vault-pass-file VAULT_PASSWORD_FILES
|
||
vault password file
|
||
--version show program's version number and exit
|
||
--view Automatically open the resulting SVG file with your
|
||
system’s default viewer application for the file type
|
||
-e EXTRA_VARS, --extra-vars EXTRA_VARS
|
||
set additional variables as key=value or YAML/JSON, if
|
||
filename prepend with @
|
||
-h, --help show this help message and exit
|
||
-i INVENTORY, --inventory INVENTORY
|
||
specify inventory host path or comma separated host
|
||
list.
|
||
-o OUTPUT_FILENAME, --output-file-name OUTPUT_FILENAME
|
||
Output filename without the '.svg' extension. Default:
|
||
<playbook>.svg
|
||
-s, --save-dot-file Save the dot file used to generate the graph.
|
||
-t TAGS, --tags TAGS only run plays and tasks tagged with these values
|
||
-v, --verbose verbose mode (-vvv for more, -vvvv to enable
|
||
connection debugging)
|
||
|
||
```
|
||
|
||
## Configuration: ansible.cfg
|
||
|
||
The content of `ansible.cfg` is loaded automatically when running the grapher according to Ansible's behavior. The
|
||
corresponding environment variables are also loaded.
|
||
|
||
The values in the config file (and their corresponding environment variables) may affect the behavior of the grapher.
|
||
For example `TAGS_RUN` and `TAGS_SKIP` or vault configuration.
|
||
|
||
More information [here](https://docs.ansible.com/ansible/latest/reference_appendices/config.html).
|
||
|
||
## Limitations
|
||
|
||
- Since Ansible Playbook Grapher is a static analyzer that parses your playbook, it's limited to what can be determined
|
||
statically: no task is run against your inventory. The parser tries to interpolate the variables, but some of them are
|
||
only available when running your playbook (
|
||
ansible_os_family, ansible_system, etc.). The tasks inside any `import_*` or `include_*` with some variables in their
|
||
arguments may not appear in the graph.
|
||
- The rendered SVG graph may sometime display tasks in a wrong order. I cannot control this behavior of Graphviz yet.
|
||
Always check the edge label to know the tasks order.
|
||
- The label edge may overlap with each other. The edge labels are positioned so that they are as close as possible to
|
||
the target nodes. If a single role is used in multiple plays or playbooks, this can happen.
|
||
|
||
## Contribution
|
||
|
||
Contributions are welcome. Feel free to contribute by creating an issue or submitting a PR :smiley:
|
||
|
||
### Dev environment
|
||
|
||
To setup a new development environment :
|
||
|
||
- Install graphviz (see above)
|
||
- (cd tests && pip install -r requirements_tests.txt)
|
||
|
||
Run the tests and open the generated files in your system’s default viewer application:
|
||
|
||
```shell script
|
||
export TEST_VIEW_GENERATED_FILE=1
|
||
$ make test # run all tests
|
||
```
|
||
|
||
The graphs are generated in the folder `tests/generated_svg`. They are also generated as artefacts
|
||
in [Github Actions](https://github.com/haidaraM/ansible-playbook-grapher/actions). Feel free to look at them when
|
||
submitting PRs.
|
||
|
||
## License
|
||
|
||
GNU General Public License v3.0 or later (Same as Ansible)
|
||
|
||
See [LICENSE](./LICENSE) for the full text
|
||
|
||
|
||
|